Keynote Spin-Off Strategy


Spin-OffsAn ideal building block for an equity portfolio
Spin-offs generate excess returns and, due to company-specific drivers, are less dependent on overall market fluctuations.
1Spin-offs generate excess returns
The empirical evidence from several long-term academic studies shows that spin-offs have consistently outperformed the broader equity market.
This has been the case regardless of whether growth or value, small caps, mid caps, or large caps were in favour, and irrespective of whether the investment environment was shaped by inflation, disinflation, or deflation.
| Year | Authors | Number of Spin-Offs Analysed | Period | Region | 6 Months | 12 Months | 24 Months | 36 Months |
|---|---|---|---|---|---|---|---|---|
| 1993 | Cusatis et al. | 141 | 1965-1990 | USA | -1.0% | 4.5% | 25.0% | 33.6% |
| 1999 | Desai and Jain | 155 | 1975-1991 | USA | 15.7% | 36.2% | 32.3% | |
| 2001 | McConnell et al. | 96 | 1989-1995 | USA | 8.9% | 7.2% | 5.8% | -20.9% |
| 2004 | McConnell et al. | 311 | 1965-2000 | USA | 12.2% | 10.6% | 8.2% | 2.9% |
| 2005 | Rüdisüli | 229 | 1990-2003 | USA / Europe | 18.9% | 30.9% | 55.8% | |
| 2012 | Credit Suisse | 151 | 1995-2012 | USA | 13.4% | |||
| 2015 | McConnell et al. | 153 | 2001-2013 | USA | 4.8% | 8.5% | 17.1% | 26.5% |
| 2014 | Deloitte | 385 | 2000-2014 | Global | 21.0% | 45.0% | ||
| 2017 | S&P Global | 516 | 1989-2016 | USA / Europe | 3.3% | 8.4% | 10.2% | 22.1% |
2Spin-offs offer systematic opportunities for active investors
Spin-offs typically receive limited market attention and are often not well understood by investors. This is unwarranted, as historical evidence shows that both the parent company—and in particular the spin-off entity—tend to outperform following the separation.
The structural characteristics of spin-offs regularly give rise to valuation inefficiencies:
- Initial selling pressure, as the spin-off may operate in a different industry or be small relative to the parent company.
- Systematic index-driven selling regardless of price, combined with limited analyst coverage.
- Management incentives that may favour a deliberately conservative initial valuation.
- Increased strategic focus of the independent entity, leading to operational improvements and subsequent re-rating in the market.
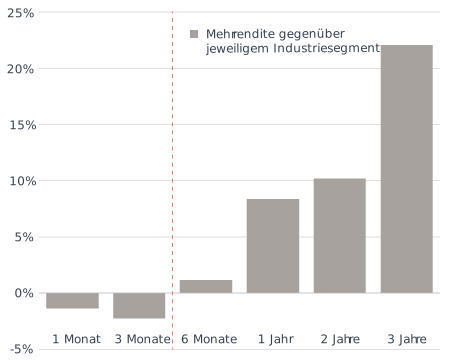
Source: S&P Global Market Intelligence Quantamental Research
3Spin-offs are an ideal satellite allocation
Spin-offs tend to be underfollowed by investors and therefore represent an attractive complement to passive core equity allocations.
Portfolio building blocks in less efficient markets
«Over-owned»
«Over-researched»
High correlations
Government Bonds
Corporate Bonds (Investment Grade)
U.S. / Global Large Caps
Technology Equities
Hedge Funds
«Under-owned»
«Under-researched»
Lower correlations
High Yield
Microcaps/Small Caps
Emerging Markets / Frontier Markets
Spin-Offs
Real Assets
Spin-offs: excess returns and diversification for your portfolio
- What spin-offs are and why they are carried out
- Why spin-offs receive limited market attention and are often misinterpreted by investors
- Why the specific “mechanics” of spin-offs create attractive opportunities
- What to focus on when evaluating spin-offs
- Which spin-offs currently appear particularly attractive
Keynote Insights: Inefficient segments of the equity market: Spin-offs
Learn in the white paper why spin-offs represent an attractive investment opportunity.
A spin-off refers to the separation of one or more business units from a company, whereby shares in the newly created entity are distributed to the existing shareholders.
Spin-offs represent a less efficient segment of the equity market, typically characterised by limited analyst coverage and low weighting in most investor portfolios.
1 + 1 = 3: In successful spin-offs, both the parent company and the separated entity ultimately perform better than they did prior to the transaction.
Investors can benefit from potential share price appreciation in both the parent company and the newly independent entity.
Ablauf einer Abspaltung mittels Spin-Off 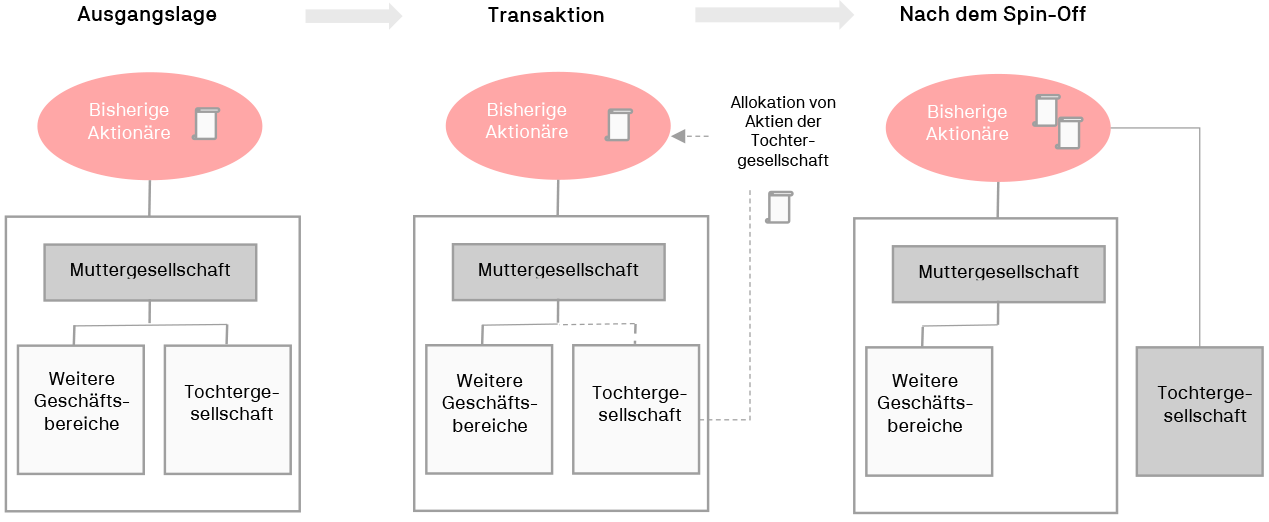
Source: Keynote Funds AG
Spin-offs typically create attractive investment opportunities through the re-rating of the separated business unit and, in many cases, also of the parent company.
Successful active selection requires identifying high-quality spin-offs while avoiding less attractive separations.
- Proven excess returns:
Multiple studies confirm that spin-offs tend to outperform the market over the first 12 to 36 months. - Operational improvements:
As independent entities, companies can allocate capital more efficiently, better manage research and development, and enhance overall operational performance. - Spin-off effect:
Initial selling pressure often creates attractive entry opportunities. - Clear success factors:
The key drivers distinguishing successful from unsuccessful spin-offs have been extensively analysed and are well understood. - Valuation:
Typically attractive valuations, as—unlike IPOs—no proceeds flow to the parent company, reducing incentives for maximising the initial pricing. - High liquidity:
Daily liquidity ensured through stock exchange listing.
- Proven excess returns:
Spin-offs offer advantages over comparable investments
Spin-offs combine the most attractive characteristics of traditional equity investments and private equity.
| Private equity | Spin-offs | Equity index funds | |
|---|---|---|---|
Operational improvements | Margin optimisation | Margin expansion through increased focus | Margins at record levels |
High quality | Revenue growth 2023:
4%
EBIDTA margin 2023:
8%
FCF margin 2023:
0% | Revenue growth 2023:
6.9% KSOF
EBITDA margin 2023:
22.9% KSOF
FCF margin 2023:
11.5% KSOF | Revenue growth 2023:
4.2% S&P 500 / 5.1% STOXX Europe 600
EBITDA margin 2023:
19.4% S&P 500 / 17.3% STOXX Europe 600
FCF margin 2023:
9.4% S&P 500 / 7.9% STOXX Europe 600 |
Attractive valuation | EV/EBIDTA 2023:
North America 10.8x, Europe 11.1x | EV/EBITDA 2023:
KSOF 13.6x | EV/EBITDA 2023:
S&P 500 14.0x, STOXX Europe 600 9.5x |
High liquidity | Capital lock-up 2–10 years | Daily liquidity | Daily liquidity |
Low fees | Fixed fee 1.5-3.0%,
Performance fee 10%+ | Fixed fee 1.1–1.6%,
no performance fee | Fixed fee 0.1–0.5%,
no performance fee |
«Underowned» | AuM 2023: USD 4.4 trillion*
Value of buyout deals 2023: USD 438 billion | AuM 2023: USD 65 million
Value of spin-off deals 2023: USD 125 billion | AuM 2023: USD 15.1 trillion
Inflows 2023: USD 466 billion |
Low volatility | Optically low, as no daily pricing is available | Volatility comparable to equity indices | Increasing volatility due to high passive ownership |
Extensive experience of the Keynote team
Over the past twelve years, the team has invested in more than 100 spin-off situations, consistently demonstrating its ability to generate value for investors.
| Performance | Current Year | 1 Year | 3 Years | 5 Years | 10 Years | Since Incep. |
|---|---|---|---|---|---|---|
| Keynote Spin-Off Composite¹ | 9.1% | 9.1% | 84.7% | 150.1% | 654.7% | 2611.7% |
| MSCI World Total Return Index² | 6.8% | 6.8% | 64.7% | 89.4% | 208.5% | 476.3% |
| MSCI World SMID Cap Index² | 4.4% | 4.4% | 36.9% | 47.8% | 125.5% | 322.2% |
| Keynote Spin‑Off Composite (KSOC) | MSCI World Total Return Index | MSCI World SMID Cap Index | |
|---|---|---|---|
| Return (p.a.) | 26.6% | 13.3% | 10.8% |
| Standard Deviation (p.a.) | 18.6% | 14.8% | 15.1% |
| Sharpe Ratio | 1.53 | 0.96 | 0.81 |
| Active Share | 99% | — | — |
| Correlation | KSOC | 0.84 | 0.85 |
| Bull Capture Ratio | KSOC | 1.15 | 1.14 |
| Bear Capture Ratio | KSOC | 0.90 | 0.88 |
| Positive Years (relative to Index) | KSOC | 11 / 14 | 13 / 14 |
¹The performance of the Keynote Spin-Off Composite includes all investments made by the investment team in spin-offs, related structures (split-offs, equity carve-outs, Reverse Morris Trusts), and parent companies since the end of 2011. The Keynote Spin-Off Composite represents an equally weighted portfolio with monthly rebalancing, in which spin-offs, related structures, and parent companies are included from the date of separation and held in the portfolio for a period of five years. Since 2021, the portfolio has been actively managed on an equally weighted basis. All performance data and statistics of the Keynote Spin-Off Index are presented on a gross basis (net of fees since the end of July 2023), i.e. without taking into account transaction costs and management fees. The presentation is for illustrative purposes only, demonstrating the implementation of the Keynote spin-off strategy in funds and equity mandates, and does not represent an exact indicator of investment success or returns.
²The MSCI World Total Return Index represents large- and mid-cap companies across 23 developed market countries. With 1,540 constituents, the index covers approximately 85% of the free float-adjusted market capitalization in each country. The index is rebalanced semi-annually in May and November, during which the thresholds for large- and mid-cap segments are recalculated. The MSCI World Total Return Index assumes reinvestment of dividends. Performance data and statistics are also shown on a gross basis, i.e. excluding transaction costs, any applicable (withholding) taxes, or fees. The instruments presented are not investable financial instruments; therefore, the performance is not calculated in accordance with the BVI methodology after deduction of all costs. Past performance is not a reliable indicator or guarantee of future results.
Source: Bloomberg, Keynote